Breaking Through Barriers with Value-Based Plan Design
Finding a Valuable PBM Partner
Facing increased pharmacy benefit expenses, Blain’s Farm and Fleet, a Midwestern employer group, desired to improve plan performance. Specifically it was interested in educating eligible members about the benefits available to them, promoting cost-effective behaviors and identifying cost-savings opportunities via real-time modeling. Blain’s was also seeking enhanced support for its coronary heart disease (CHD) and diabetes case management program, which could benefit many of its members.
Developing a Focused Strategy
Collaborating with Blain’s to develop a focused strategy for targeted member populations, Navitus proposed the use of value-based plan design programs. Tailored to specific population needs, these programs encourage medical care and improve access to high-touch services by reducing or eliminating financial barriers. Evidence suggests that this promotes adherence, improves member health and can ultimately reduce hospitalization and medical costs.
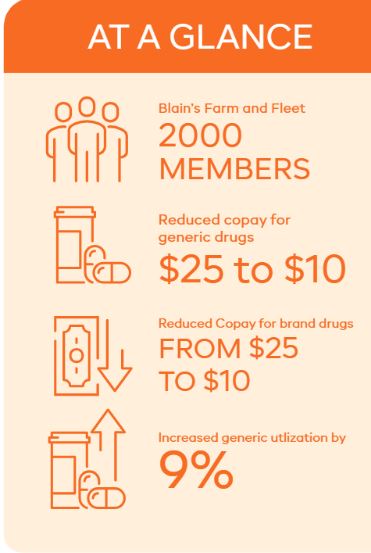
With these goals in mind, Blain’s implemented CHD and diabetes condition management programs that reduced the copay for generic drugs from $10 to $2 and preferred brand drugs from $25 to $10 for enrolled members.
Increasing Member Adherence
As a result of the lower generic copay, Blain’s saw its generic utilization rate increase to over 9%.
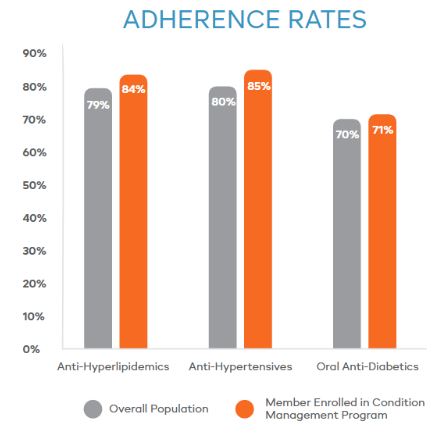
More importantly, adherence rates for members enrolled in Navitus’ condition management program increased significantly, as shown in the table at the right.
Value-based programs are an effective solution for helping members remain adherent to their medications and better manage their disease states, ultimately lowering medical costs for both members and plans.
Getting Started
Are you interested in exploring a truly transparent, pass-through model could lower your plan spend and increase value to your employees? Contact us at [email protected] to learn more.
Stay Informed and Connected
Receive expert insights, healthcare tips, and important updates on pharmacy benefits, drug recalls, and more—straight to your inbox.
CLARITY FOR ACTION
Gain Clarity: Navitus 10th Annual Drug Trend Report Ready to Download
Our 2025 report provides transparent, data-driven insight to help plans, plan sponsors and consultants navigate an increasingly complex prescription drug landscape.
Related blogs
Navigating Healthcare and Improving Outcomes

Get to Know the PBM Pass-through Model
In the world of pharmacy benefit management (PBM), there are multiple models a company can follow, including the pass-through, hybrid and traditional models. While all PBMs negotiate discounts and rebates with manufacturers on behalf of their clients,…


