At Navitus, we remain focused on delivering the lowest net cost, so that medications can be more affordable for the people who need them.
Sharon Faust, PharmD, MBA, CSP
Chief Pharmacy Officer
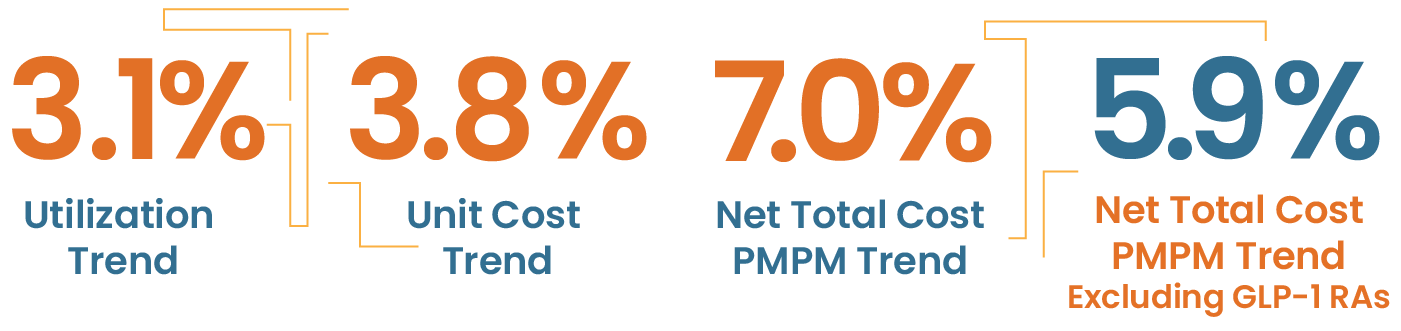
Utilization Trend
Unit Cost Trend
Net Total Cost
PMPM *Trend
Net Total Cost
PMPM Trend
excluding GLP-1s

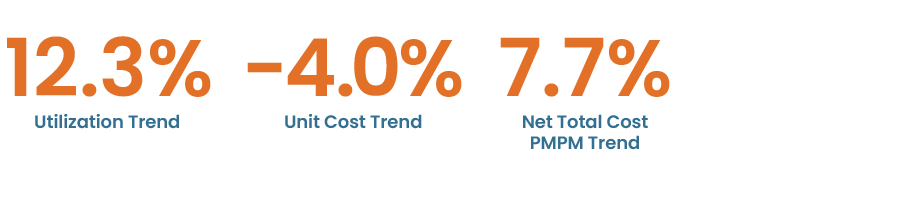
Specialty trend drivers
Increasing: oncology, dermatology
Decreasing or stable: targeted immunomodulators (TIMs), multiple sclerosis (MS)
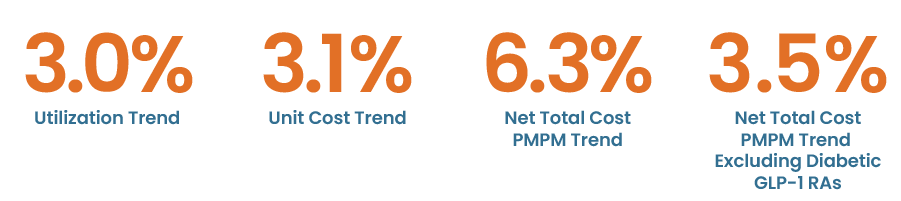
Non-specialty trend drivers
Increasing: diabetes, migraine, antivirals
Decreasing or stable: attention-deficit/hyperactivity disorder (ADHD)
Learn more about these industry shifts in the Drug Trend Report
Learn more about these industry shifts in the Drug Trend Report

Members are more than just numbers to us
Heidi Minter
Data Analyst, Benefits Design & Services, Progressive Insurance

Close to home: A mother’s story
Amanda, Manager of Experiential Learning and Chair of the accredited Oncology Center of Excellence, has been a specialty pharmacist at Lumicera since 2023. For the past two years, she has also been a caregiver for a cancer patient…her son.
Learn more about their unique journey:
NAVITUS | 2024 Drug Trend Report
NAVITUS | 2024 Drug
Trend Report
Download the
Drug Trend Report
Executive Summary
Download the
Full Drug Trend
Report
I’d like the latest updates from Navitus
Methodology
The Navitus drug trend is calculated by comparing the net total cost PMPM for 2024 to that for 2023. Net cost PMPM represents full-year (Q1-Q4) data for total member copays and plan paid amounts, minus manufacturer rebates and fees. This value is divided by the total number of members and by 12 months of the year.
Net total cost PMPM trend consists of two components — utilization and cost — and includes both specialty and non-specialty drugs. Utilization trend measures the change in total days of therapy. Cost trend measures the change in net total drug cost per day of therapy. This analysis included data for more than 600 clients, representing 3.4M members within Navitus’ commercial book of business, including employer plan sponsors and health plans. To be included, these organizations must have been clients of Navitus in both 2023 and 2024. Exclusions from this analysis include products administered at physicians’ offices, clinics and hospitals, products subsidized by the federal government (i.e. COVID-19 vaccines/treatments), products excluded by benefit design (weight loss, infertility) and any additional savings from copay assistance programs.